BIPS Performance Indicators in 2014
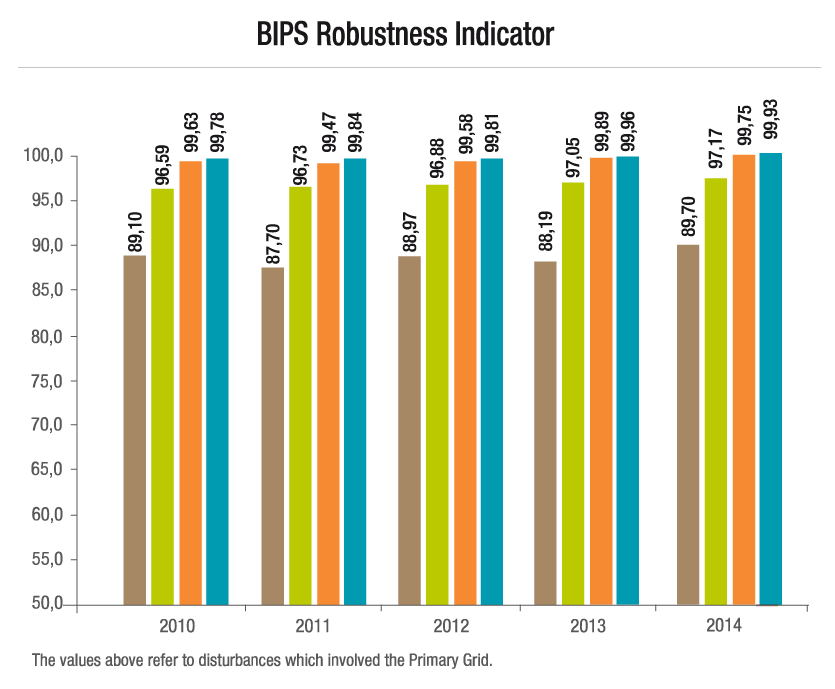
From the total of 2,972 disturbances recorded in 2014, only two (0.07%) load cuts were more than 1,000 MW. In Figure 1, it can be observed that there were seven events (0.2%) with a load of 500 MW cut, and further a total of 84 (2.8%) with a load of 100 MW cut.
Figure 1 - Evolution in number of disturbances and their impact into the BIPS
BIPS Robustness Indicator
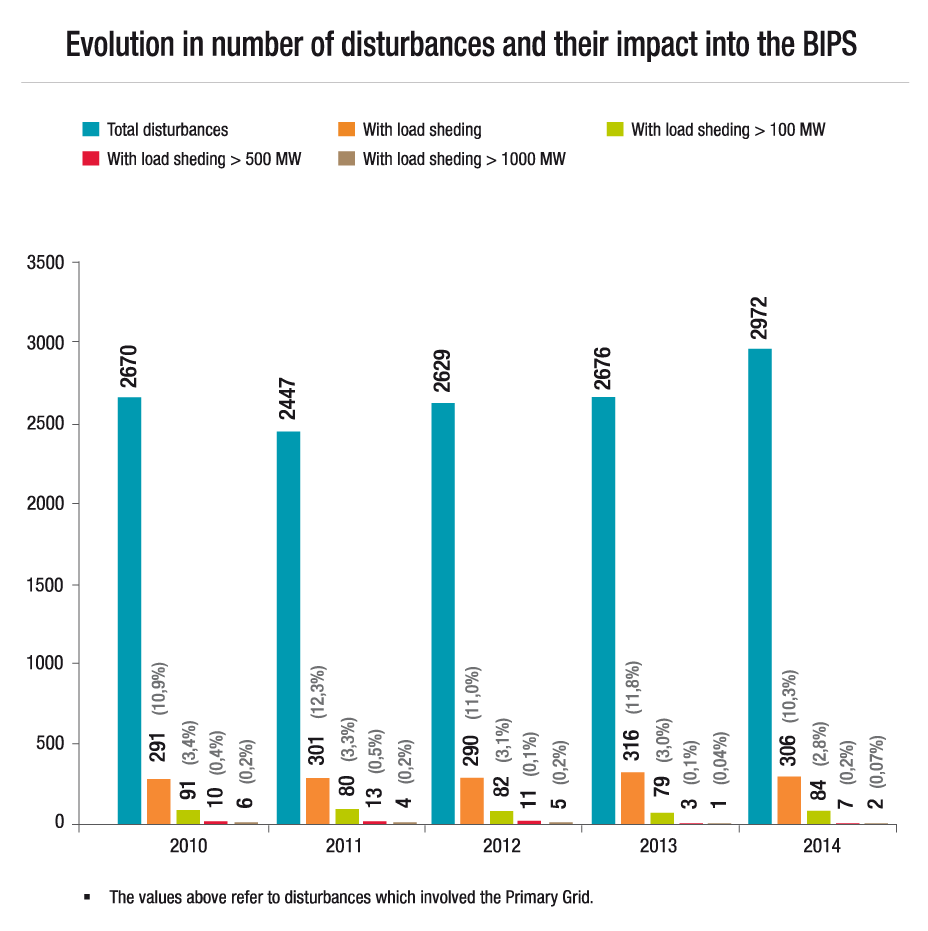
The safety of the electric service achieved in 2014 can be translated by the BIPS performance indicators. A fairly representative indicator is the robustness, because it relates the disturbances in the BIPS with the load supply. The value of this indicator is given by the relation between the number of disturbances with a certain level of load shedding and total number of disturbances.
The values calculated for the robustness index in 2014 are as follows, as shown in Figure 2:
- for any load cut - robustness was 89,70%;
- for load cut above 100 MW - robustness was 97,17%.
- for load cut above 500 MW – robustness was 99,76%.
- for load cut above 1,000 MW – robustness was 99,93%.
Figure 2 – BIPS Robustness Index between 2010 and 2014