
BIPS Performance Indicators in 2013
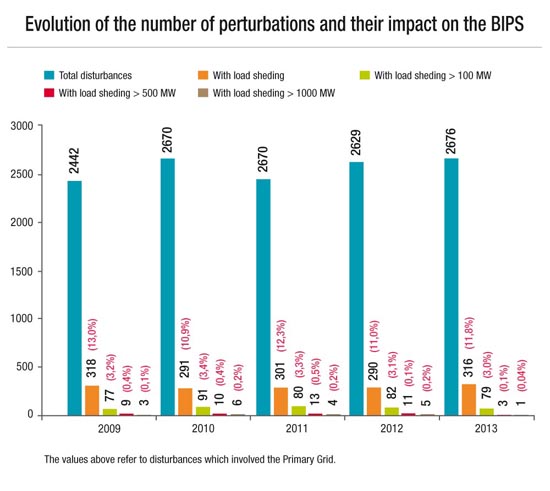
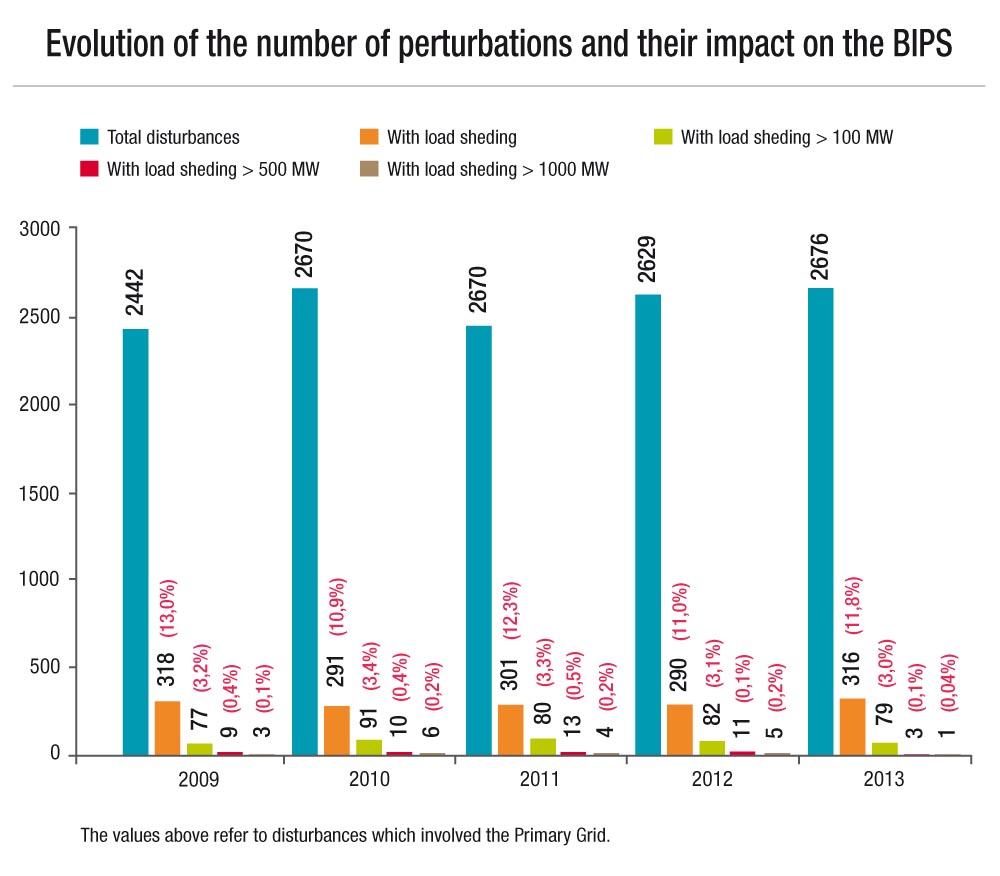
Do total de 2.676 perturbações registradas em 2013, cabe destacar que em apenas 1 (0,04%) os cortes de carga foram superiores a 1.000 MW. No gráfico a seguir, pode-se observar que houve 3 eventos (0,1%) com corte de carga superior a 500 MW, e ainda um total de 79 (3,0%) com corte de carga superior a 100 MW.
Of the total of 2,676 recorded disturbances in 2013, it is worth noting that in only 1 (0.04%) the load cuts were higher than 1,000 MW. In the graph below it can be seen that there were 3 events (0.1%) with a cutoff up to 500 MW load, plus a total of 79 (3.0%) with a cutoff up to 100 MW load.
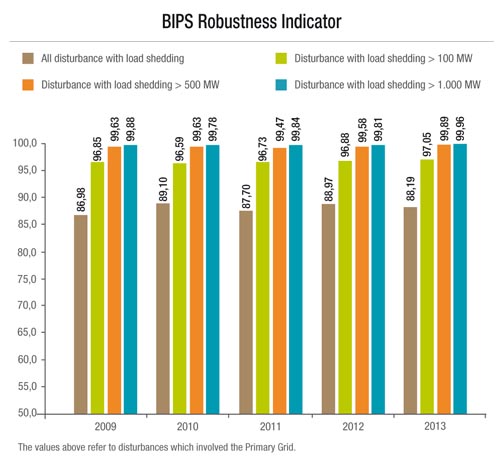
BIPS Robustness Indicator
The electrical safety compliance achieved in 2013 can be translated by the performance indicators of the BIPS. A fairly representative indicator is the robustness, because it relates the disturbances in BIPS with the supply to the loads. The value of this indicator is given by the ratio between the number of disturbances with a given level of load shedding and the total number of disturbances.
The calculated values for the index of robustness in the year 2013 are as follows:
- for any load shedding - robustness was 88.19%;
- for cuts for load above 100 MW - robustness was 97.05%.
- for cuts for load above 500 MW - robustness was 99.89%.
- for cuts for loads above 1,000 MW - robustness was 99.96%.