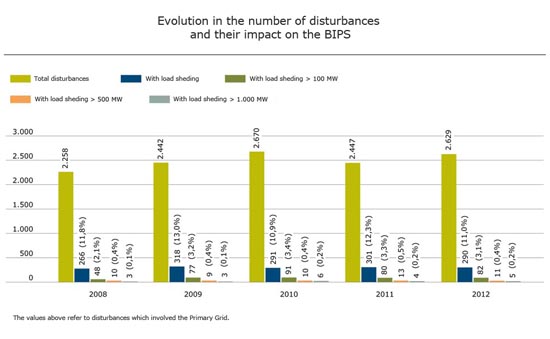
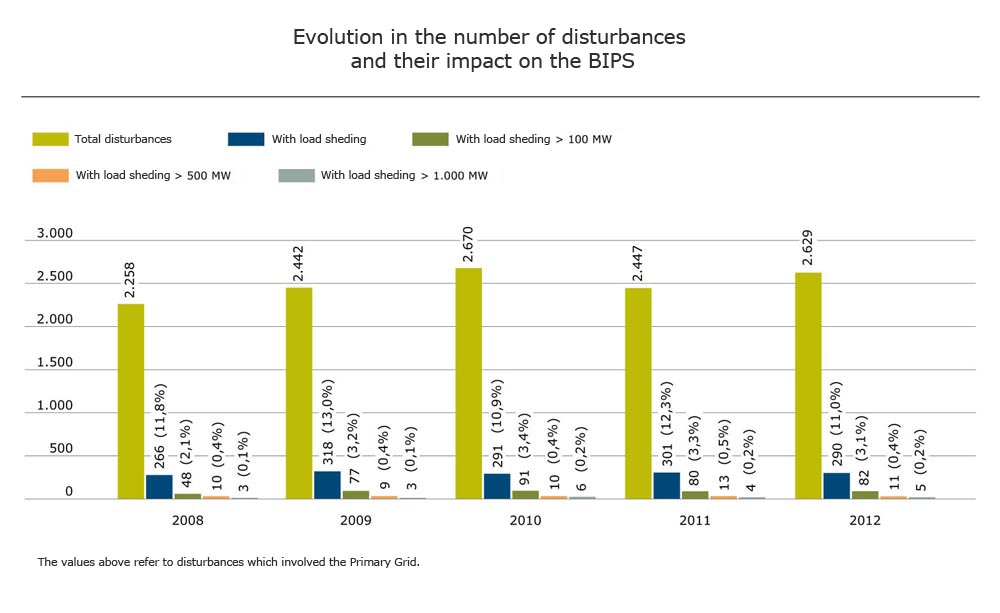
BIPS Performance Indicators in 2012
From the total of 2,629 registered disturbances in 2012, it is noteworthy that in only five (0.2%) the load cuts were more than 1,000 MW. In the graph below, it is observed that there were 11 events (0.4%) with load cut exceeding 500 MW, and a total of 82 (3.1%) with load cut exceeding 100 MW.
The table below shows the growth of the length of transmission lines and transformation capacity of the Basic Grid in this period. The comparison of performance indicators with size of the grid shows that there is has been stability in these indicators over the last few years, even having a significant increase in the number of circuits and equipment of the transmission grid.
Basic Grid |
2008 | 2009 | 2010 | 2011 | 2012 |
Extension of LTs (km) |
90.316,4 | 95.464,9 | 98.648,3 | 103.361,7 | 105.929,1 |
Transformation |
225.100,8 | 233.875,8 | 242.075,5 | 252.766,8 | 274.237,8 |
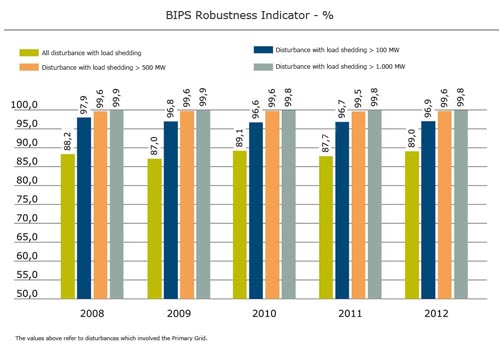
BIPS Robustness Indicator
The electrical security compliance achieved in 2012 can be translated by the performance indicators of the BIPS. An indicator quite representative is robustness, because it relates the disturbances in the BIPS with the supply to the loads. The value of this indicator is given by the ratio between the number of disturbances with a certain level of load cut and the total number of disturbances.
Considering that the total of disturbances in 2012 was 2,629, we have the following values for robustness indicator:
- for any load cut - robustness was 89.0%;
- for load cuts above 100 MW - robustness was 96.9%.
- for load cuts above 500 MW - robustness was 99.6%.
- for load cuts above 1,000 MW - robustness was 99.8%.
It is noteworthy that the robustness indicators calculated in 2012 remained at the same level of previous years, from 2008 to 2011.