
BIPS Performance Indicators in 2011
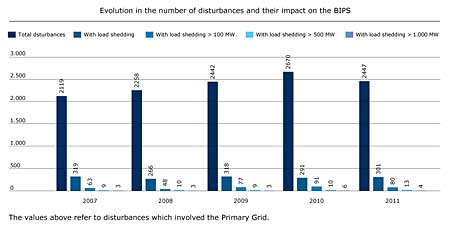
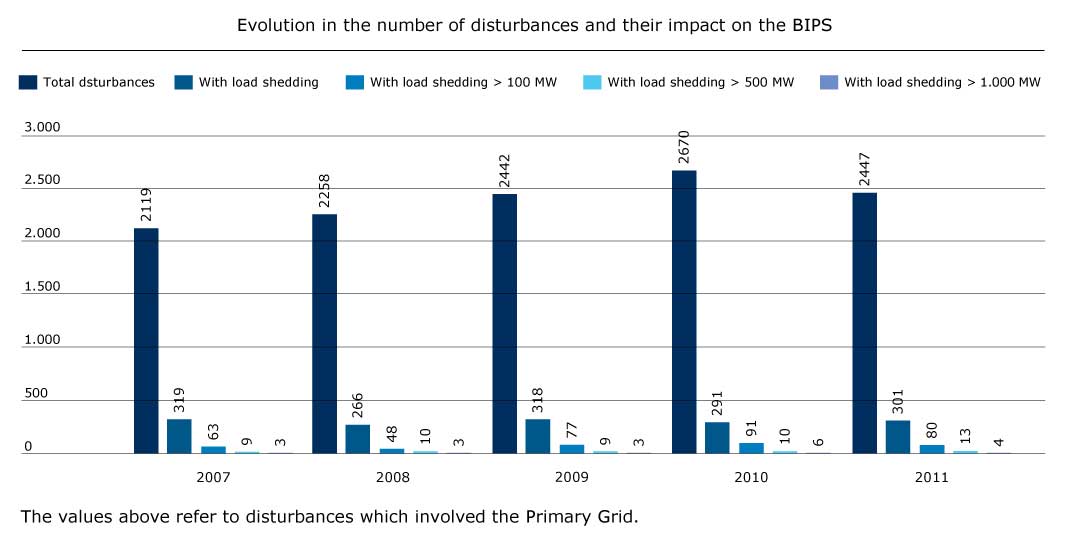
Of the total 2447 disturbances recorded in 2011, is worth mentioning that in only four (0.2%) the load cuts were above 1,000 MW. In the graph below, it can be noted that there are thirteen events (0.5%) with cutting load exceeding 500 MW, and also a total of eighty (3.3%) with loss of load higher than 100 MW.
Number of disturbances and their impact on the BIPS
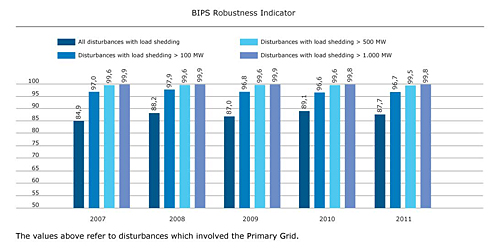
Robustness Indicator of the BIPS
The security in power service achieved in 2011 can be represented by the performance indicators of the BIPS. Robustness is a fairly representative indicator, because it indicates the disturbances in the BIPS with the supply to the loads. The value of this indicator is given by the relation between the number of disturbances and at a certain level of load shedding and the total number of disturbances.
Considering that the total of disturbances in 2011 was 2,447, the following values for the index of robustness can be observed:
- for any load shedding – robustness was 87.7%;
- for load shedding above 100 MW – robustness was 96.7%.
- for load shedding above 500 MW – robustness was 99.5%.
- for load shedding above 1,000 MW – robustness was 99.8%.
It is worth mentioning that the indicators of robustness established in 2011 remained the same level of previous years, from 2007 to 2010.